OBI and Kubernetes quickstart
You are viewing the English version of this page because it has not yet been fully translated. Interested in helping out? See Contributing.
Kubernetes is fully integrated into the OBI operation mode.
On one side, metrics and traces can be decorated with the metadata of the Kubernetes entities running the automatically instrumented services.
On the other side, DaemonSet has become the preferred deployment mode for OBI: thanks to the versatility of the new service selectors, a user can precisely define which services need to be instrumented and which don’t. A single instance of OBI will be able to instrument the selected group of services within a single Kubernetes node.
OBI service selectors
A service selector is a set of properties that let OBI to query which processes need to be instrumented.
When OBI is deployed as a regular operating system process that instrument other
processes, the unique service selectors are the network port where the
instrumented process should be listening to (can be specified with the
OTEL_EBPF_OPEN_PORT environment variable) or a
Glob to match against the
executable filename of the process to instrument (OTEL_EBPF_AUTO_TARGET_EXE
environment variable).
To select multiple groups of processes, the OBI YAML configuration file format
provides a discovery.instrument section that accepts multiple selector groups:
discovery:
  instrument:
    # Instrument any process using the ports from 8080 to 8089
    - open_ports: 8080-8089
    # Instrument any process whose command line path contains "http"
    - exe_path: '*http*'
    # Instrument any process with a command line path containing "nginx"
    # and using the port 443 (both conditions must be fulfilled)
    - open_ports: 443
      exe_path: '*nginx*'
The above criteria are insufficient for Kubernetes pods where the ports are ephemeral and internal to the pods. Also, pods are a level of abstraction that should hide details such as the name of their executables. For that reason, OBI makes it possible to use Kubernetes attributes in the service instrumentation selection criteria. All of them accept a glob as value:
k8s_namespace: only instrument applications in the namespace matching the provided glob.k8s_deployment_name: only instrument Pods that belong to a Deployment with a name matching the provided glob.k8s_replicaset_name: only instrument Pods that belong to a ReplicaSet with a name matching the provided glob.k8s_pod_name: only instrument Pods with a name matching the provided glob.
Example scenario
1. Deploy testing instrumentable services
You can instrument any HTTP or HTTPS service in your Kubernetes cluster. If you prefer, you can first try instrumenting the dummy services provided in this example.
The following Kubernetes example file contains two Apache HTTP servers: one
pretends to be a company website and the other pretends to be a documentation
site (docs). Let’s ignore that both servers will just return an “It Works!”
string when the root directory is requested and a 404 error if any other path is
requested.
Copy the following contents into a file (for example, sampleapps.yml) and
deploy it with the command kubectl apply -f sampleapps.yml.
kind: Deployment
apiVersion: apps/v1
metadata:
  name: docs
spec:
  replicas: 2
  selector:
    matchLabels:
      app: docs
  template:
    metadata:
      labels:
        app: docs
    spec:
      containers:
        - name: docs-server
          image: httpd:latest
          ports:
            - containerPort: 80
              protocol: TCP
              name: http
---
apiVersion: v1
kind: Service
metadata:
  name: docs
spec:
  selector:
    app: docs
  ports:
    - protocol: TCP
      port: 80
---
kind: Deployment
apiVersion: apps/v1
metadata:
  name: website
spec:
  replicas: 2
  selector:
    matchLabels:
      app: website
  template:
    metadata:
      labels:
        app: website
    spec:
      containers:
        - name: website-server
          image: httpd:latest
          ports:
            - containerPort: 80
              protocol: TCP
              name: http
---
apiVersion: v1
kind: Service
metadata:
  name: website
spec:
  selector:
    app: website
  ports:
    - protocol: TCP
      port: 80
To test that they are up and running, open two terminal sessions and run one of each command below on a different session:
# Redirect website to local port 8080
kubectl port-forward services/website 8080:80

# Redirect docs site to local port 8081
kubectl port-forward services/docs 8081:80
From your computer, each request to http://localhost:8080 will be a
hypothetical request to the company website and each request to
http://localhost:8081 will be a hypothetical request to the documentation
website.
2. Create beyla namespace
Before configuring and deploying OBI, let’s create a beyla namespace. We will
group there all the permissions, configurations and deployments related to it:
kubectl create namespace beyla
3. Configure and run OBI
Next, you need to provide OBI with permissions to watch and inspect the metadata of the diverse Kubernetes resources that OBI’s discovery mechanism requires. You must create the following YAML file and apply it:
apiVersion: v1
kind: ServiceAccount
metadata:
  namespace: beyla
  name: beyla
---
apiVersion: rbac.authorization.k8s.io/v1
kind: ClusterRole
metadata:
  name: beyla
rules:
  - apiGroups: ['apps']
    resources: ['replicasets']
    verbs: ['list', 'watch']
  - apiGroups: ['']
    resources: ['pods', 'services', 'nodes']
    verbs: ['list', 'watch']
---
apiVersion: rbac.authorization.k8s.io/v1
kind: ClusterRoleBinding
metadata:
  name: beyla
subjects:
  - kind: ServiceAccount
    name: beyla
    namespace: beyla
roleRef:
  apiGroup: rbac.authorization.k8s.io
  kind: ClusterRole
  name: beyla
And now, deploy OBI by creating the following Kubernetes entities:
- A
ConfigMapstoring thebeyla-config.ymlOBI configuration file, which defines the service discovery criteria. To verify that OBI is able to discriminate by service instance even if they run the same image and executable, OBI is configured to select ONLY thedocsApache web server. - A OBI
DaemonSetproviding the OBI pod and its configuration:- Loads the
beyla-config.ymlfile from theConfigMap, as specified in theOTEL_EBPF_CONFIG_PATHenvironment variable. - References to the
grafana-secretsvalues for the endpoint and credentials. - Uses the
beylaServiceAccountto get all the permissions.
- Loads the
Copy and deploy the following YAML file:
apiVersion: v1
kind: ConfigMap
metadata:
  namespace: beyla
  name: beyla-config
data:
  beyla-config.yml: |
    # this is required to enable kubernetes discovery and metadata
    attributes:
      kubernetes:
        enable: true
    # this will provide automatic routes report while minimizing cardinality
    routes:
      unmatched: heuristic
    # let's instrument only the docs server
    discovery:
      instrument:
        - k8s_deployment_name: "docs"
        # uncomment the following line to also instrument the website server
        # - k8s_deployment_name: "website"
---
apiVersion: apps/v1
kind: DaemonSet
metadata:
  namespace: beyla
  name: beyla
spec:
  selector:
    matchLabels:
      instrumentation: beyla
  template:
    metadata:
      labels:
        instrumentation: beyla
    spec:
      serviceAccountName: beyla
      hostPID: true # mandatory!
      containers:
        - name: beyla
          image: grafana/beyla:latest
          imagePullPolicy: IfNotPresent
          securityContext:
            privileged: true # mandatory!
            readOnlyRootFilesystem: true
          volumeMounts:
            - mountPath: /config
              name: beyla-config
            - mountPath: /var/run/beyla
              name: var-run-beyla
          env:
            - name: OTEL_EBPF_CONFIG_PATH
              value: '/config/beyla-config.yml'
            - name: OTEL_EXPORTER_OTLP_ENDPOINT
              valueFrom:
                secretKeyRef:
                  name: grafana-credentials
                  key: otlp-endpoint
            - name: OTEL_EXPORTER_OTLP_HEADERS
              valueFrom:
                secretKeyRef:
                  name: grafana-credentials
                  key: otlp-headers
      volumes:
        - name: beyla-config
          configMap:
            name: beyla-config
        - name: var-run-beyla
          emptyDir: {}
Also notice:
- To run in DaemonSet mode, OBI requires to have access to all the processes in
the node. Then the OBI Pod requires to run with
hostPID: true. - The OBI container needs to run with
privileged: true, as it requires to perform privileged actions such as loading BPF programs and creating BPF maps. For running OBI asunprivilegedcontainer, i.e. without theprivileged: trueoption, visit the Deploy OBI unprivileged guide.
4. Test your instrumented services and see the results in Grafana
With the kubectl port-forward commands from the firs step still running, test
both web server instances. For example:
curl http://localhost:8080
curl http://localhost:8080/foo
curl http://localhost:8081
curl http://localhost:8081/foo
Some requests will return 404 error, but it’s OK because they are also instrumented.
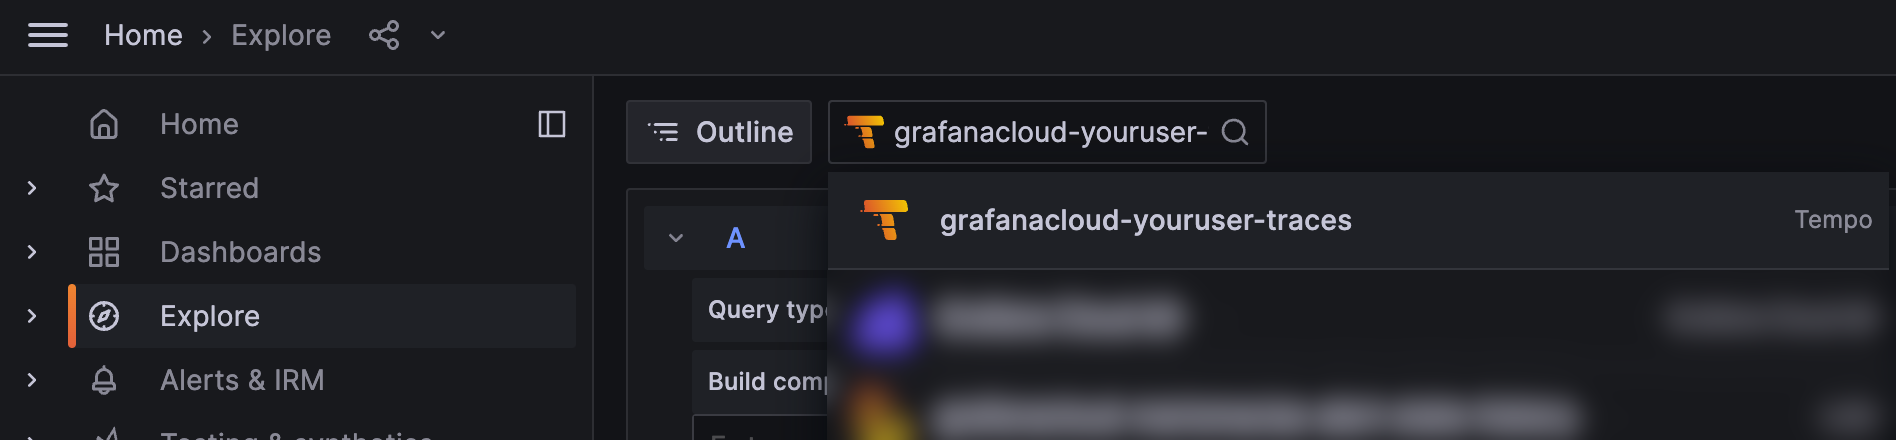
Now, go to the instance in Grafana Cloud, and from the Explore section in
the left panel, select the data source for the traces (usually named
grafanacloud-<your user name>-traces).
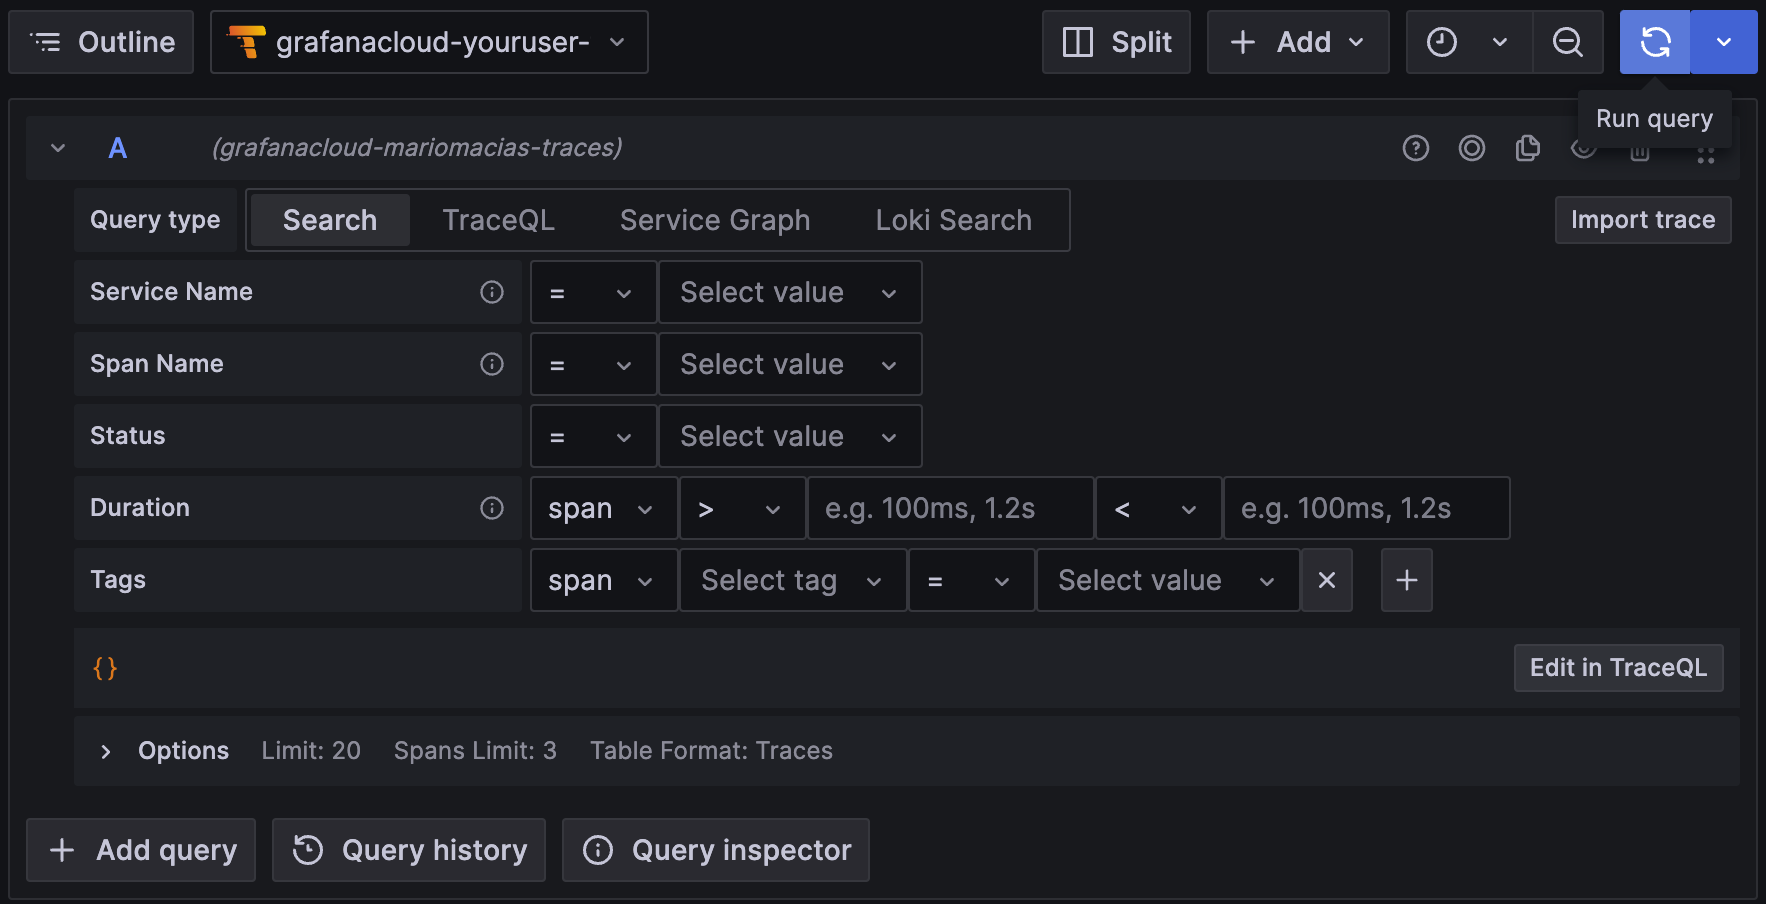
To search for all the traces, select the Search box in the Query bar, leave the form empty, and click Run query:
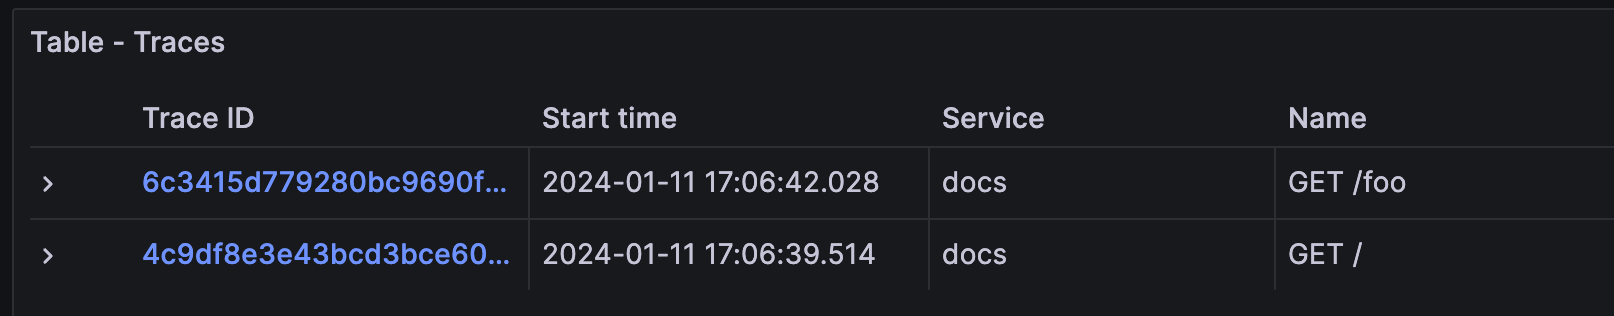
This will show the traces for the docs instance (port 8081). You might see
traces from your own services, but shouldn’t see traces from the website
service, as it has not been instrumented by OBI.
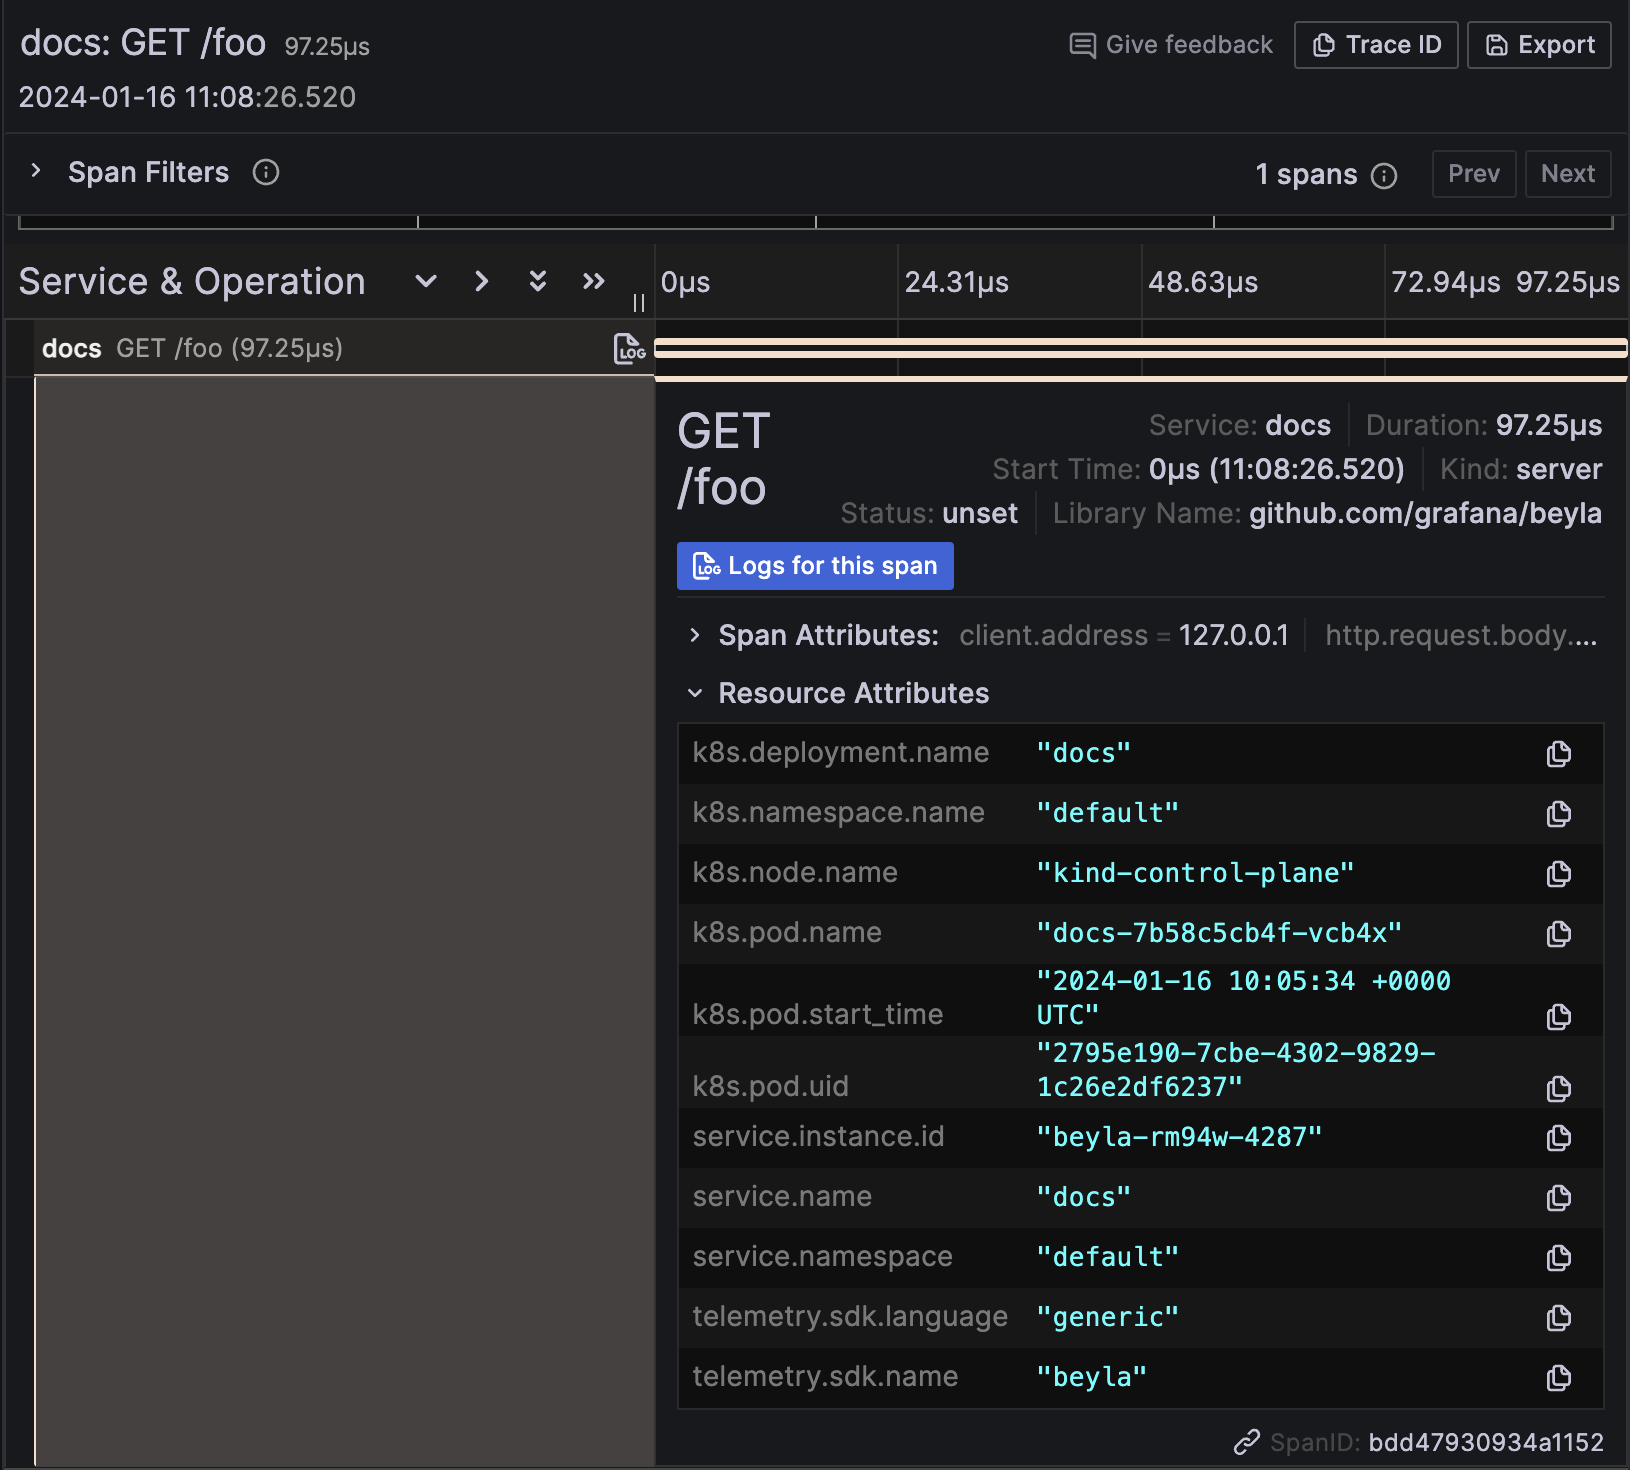
In the trace details, the resource attributes of the traces are decorated with the metadata of the Kubernetes Pod running the instrumented service:
Links
Feedback
Cette page est-elle utile?
Thank you. Your feedback is appreciated!
Please let us know how we can improve this page. Your feedback is appreciated!